Mill7 Dashboard
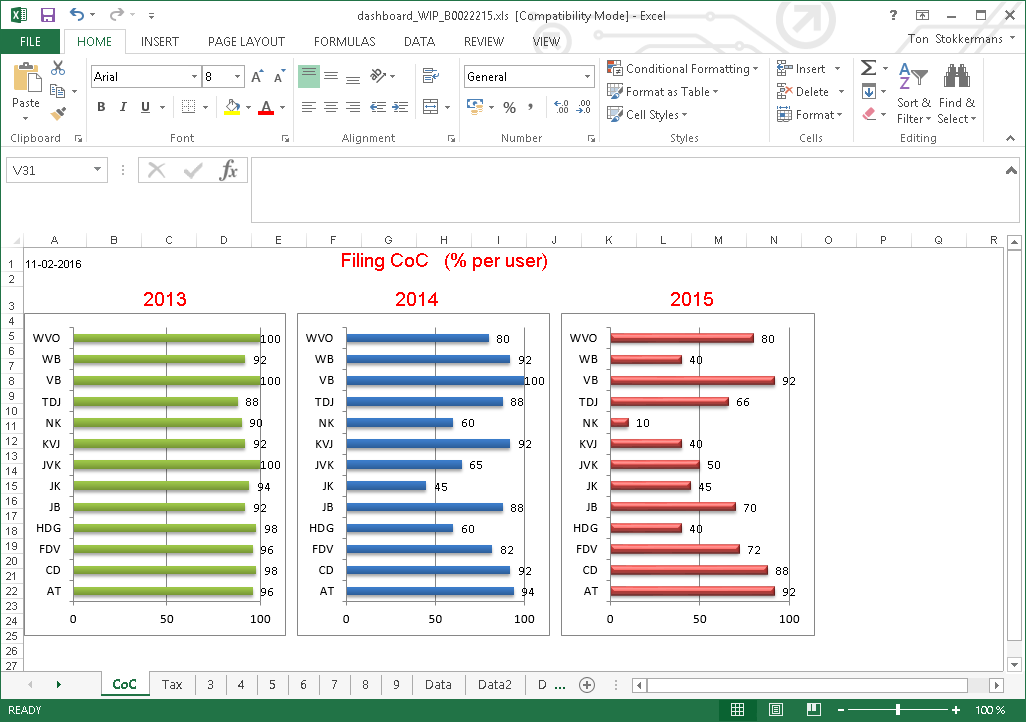
The Dashboard presents Graphical Management Information. Think about cash flow, historical P&L, chargeability, work in progress, compliance and in- and outflow.
All graphs are user defined. The data is provided by Mill7. If you need more types of data please contact the Millogic helpdesk.
The Dashboard is part of the Mill7 trust version. It comes with all Mill7 modules.
Using the Dashboard
The Dashboard is started from the Reports menu.

The Dashboard screen provides 5 category buttons and an Update button.

Each category button opens an Excel file providing data, graphs and other reports based on settings made in the update section and in the templates.

Other reports in the same category are viewed by switching tabs at the bottom. The first nine tabs can be customized to support your information needs.
Some of these tabs are already predefined by Mill7 and can be changed. The Data tabs provide the necessary data to fill the first nine tabs.
Setting the rights
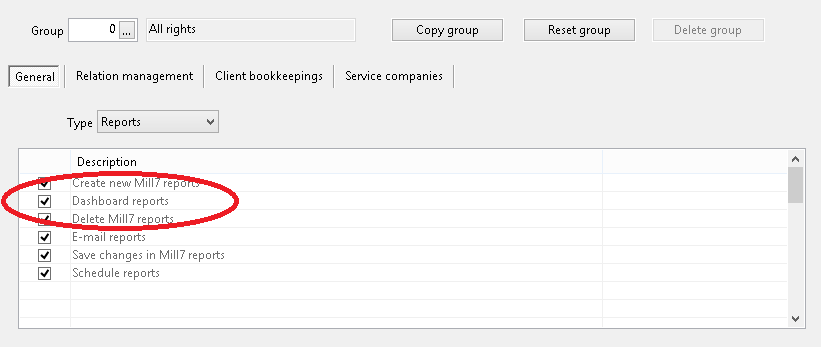
To enable users to open the Dashboard, please set the right for Dashboard reports to the appropriate user groups.
