Reports in Mill7 can be started by the reporting tool.
To create Excel reports it is not necessary to have Microsoft Excel installed.
For viewing the reports any spreadsheet program can be used.
All reports can be created in Excel or HTML.
Each report is created by using an Excel template. By default, the template "Mill7 report.xlt" in the Mill7\reports directory is used.
A HTML report is based upon ReportHeader.htm in the Mill7\Reports directory.
Reports can be created and automatically attached to an e-mail.
To be able to use this option, the user need the right 'E-mail reports'.
The e-mail is sent through the local e-mail client of the user.
Remarks:
If you want to create your own template, please do not overwrite the template in the Mill7\Reports directory. Create your own copy in the Mill7\Reports\Custom directory. This is because with every Mill7 update, the file in the Mill7\Reports directory will be overwritten.
TIP:
It is possible to create your own custom reports and add them to the custom menu.
TIP:
Some reports are defined as a default report for a specific Mill7 screen. Working in a screen, you will find these reports in the tool bar near the Printer button. Using this button opens the report module with the specific report preselected.
Create a report
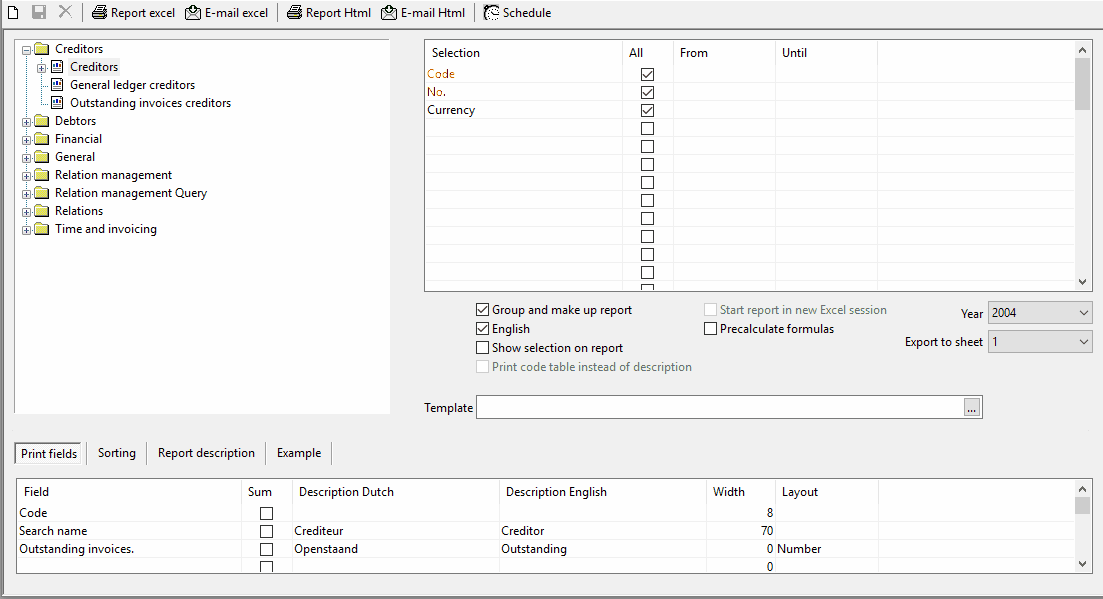
Reports can be selected from a treeview. Availability depends on licenses, modules and rights.
The definition of a report is divided in three parts.
3.Sorting

The following options affect the layout of the report.
- Group and make up report
By unchecking this option, the report will not be grouped and not be made up according to the layout profiles.
This makes it possible to create for example pivot tables in Excel.
- English
This option can be used to use the English description per column instead the Dutch descriptions.
- Show selection on report
With this option the selection criteria will be printed on the top of the report.
- Print code table instead of description
This option is only available on Relation management queries and Relation management reports.
- Start report in new Excel session
This option is only available when the setting Create spreadsheets without Excel is off.
- Precalculate formulas
This option is only available when the setting Create spreadsheets without Excel is off and can be used when the spreadsheet program in use is not compatible with Excel formulas.
- Year
All years that exist for the current bookkeeping are presented in the Year field .
By switching years the report will be printed for the indicated book year.
- Export to sheet
This option makes it possible to print the data on a chosen sheet in the Excel file. This will only work in combination with the setting Create spreadsheet without Excel.
- Template
By default the template "Mill7 report.xlt" from the Mill7\Reports directory is used to create reports.
Per report, a template can be entered and saved.
Report description
There is room to enter a description for the report in Dutch and in English.
The standard Mill7 reports come with a description that cannot be changed.
Example
This tab gives an example of what the output will look like when a default report definition is used.


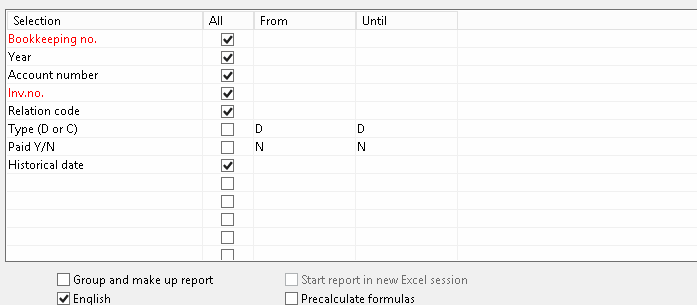
The output can be restricted by using selections.
If desired, selections can be added by pressing F4 in the first column. A list of possible fields to choose from will be presented.
There is a maximum of 12 fields that can be used in the selection.
Historical date
When using Historical date, dates are required for From and Until.

The Print fields tab is used to define the fields to be included in the report.
- Field
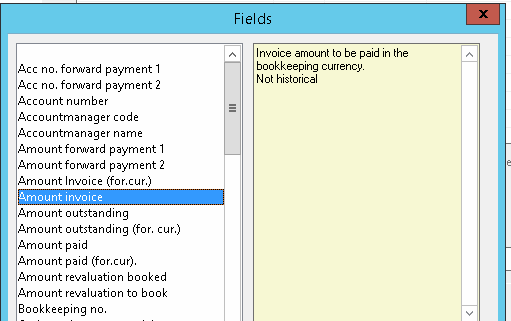
By pressing F4 in the first column, a list with possible fields will appear

Some fields come directly from the database, while others are the results of special functions. A good example is Paid Y/N.
This information can only be obtained from the database by combining different fields, in this case the amount outstanding and the amount paid. The result in this case will be a "Y" or a "N".
- Sum
Numeric fields can be summed up. The total of the column will appear at the bottom of the report.
If there are groups, a subtotal will appear per group.
- Description Dutch and English.
A report can be printed in Dutch or English. Therefore both Dutch and English descriptions can be entered here.
This is the description that is shown in the header of a column in the report.
- Width
This is the column width in Excel. By entering a width of 0, Excel will adjust the columns itself, by setting it according to the longest value in the column.
The widths entered by default will make sure that a page fits on an A4 portrait paper.
- Layout
You can choose different types of layout for a field.
- Date, Number, Integer, Color Number, User1, User2 en User3.
These layout profiles correspond with the layout profiles of Excel.
You can define the profiles User1, User2 and User3 yourself in the Excel template.

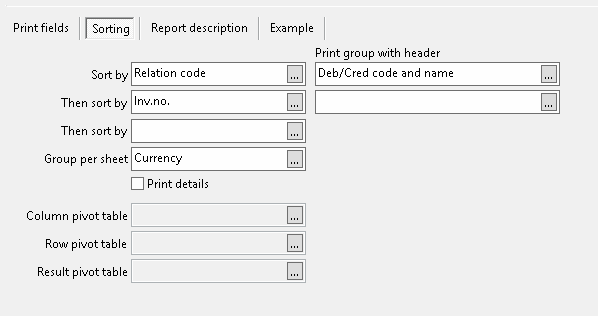
The output of the report can be sorted and grouped.
In the example above, the output is sorted per Relation code.
Groups will be printed with the relation code and the corresponding name.
At the end of every group, a group total will be printed for the fields that should be summed up according to the field settings.
The first print group can be left blank. The data will then only be sorted and not grouped. Also no totals will appear.
The second print group has less possibilities. Only the value that is sorted on can be displayed as a group or an empty line.
When the field is kept empty, no group will be created.
The third sort field has no grouping option.
Group per sheet
A third possibility to group the data is to use Group per sheet.
By using this option, all output will divided on different sheets in the Excel workbook.
In the above example, with the Currency field for Group per sheet, separate Excel sheets will be created for every currency code in the report.
Each sheet will be renamed to the value of the grouping field.
Details
This option is only useful for reports that contain totals based on detailed information.
In the shown example "Outstanding invoices debtors" all invoices are reported.
There are no further details because the database contains one record per combination of debtor and invoice number.
Using the option details therefore would sort no effect.
When you create the same report without the second sorting on the invoice number, the data will be grouped only per debtor displaying only the outstanding amount per debtor.
By selecting the option details all invoices will be shown again per debtor.
This option therefore is useful when all groups are used but more details are desired.
A good example is the report Balance sheet.
Pivot table
When the option 'Group and make up report' is not selected a pivot table can be created.
To create the pivot table the fields column, row and result pivot table should be entered.
The excel file contains in the first worksheet the data and in the second worksheet a table based on the fields as mentioned before.
Examples of pivot tables are the default reports Debtors > Turnover per debtor and Financial > Consolidation.
A custom report can be created very easily. Just add or delete fields, sorting and selections and press Ctrl+S or choose Save as from the File menu. The layout of the report will be saved in the directory Mill7\Reports\Custom with the filename {report name}.rap.
The custom file will be visualized in the treeview with reports as well, by creating another level under the original report.
The name of the report will also be used in the heading of the report itself. This name will not be translated, so choose the name carefully.
Custom reports can be started from the Custom Menu as well.
Just add an entry to the custom menu like: {report description}, {reportname}.rap.
Replace {report description} and {reportname} with appropriate description and name.
With the Run reports via server option enabled and everything set up correctly on the server, reports will be generated by the server on which Mill7 is installed. This can significantly enhance the performance of the reporting module, especially with large reports.
In this way, multiple reports can be run simultaneously, which will then be placed in a queue.

To use this functionality, a workstation or server must be set up on which the Server_reports program is constantly running.
The executable can be started from the command line or with a shortcut: "Server_reports.exe"
The Server_reports.exe command must be run from the Mill7\Prog20 directory.
If the program is not active and a user starts a report, the report will simply be started on the user's PC (the same as if the option were disabled).